Upd: 29 March 2026
 Online gambling projects can face a variety of different problems that result in financial damage. One of the common problems is fraud. With the development of technology, more sophisticated ways of deceiving online casinos or opponents in online poker emerge, making fraud prevention increasingly challenging. Owners of online gambling projects incur significant losses. For example, in 2023 alone, 888poker paid $363,000 to players affected by fraud as compensation. According to Statista, the global cost of cybercrime reached $8.15 trillion in 2023.
The problem can be solved through the effectively organised data analysis. Data analysis aids in revealing security issues. Additionally, working with data enables the prompt detection of anomalies — rare and unusual occurrences — that can reveal software errors that may not always be obvious to the administration of a casino or poker room but can grow into significant financial damage. Moreover, data analysis aids in making more accurate forecasts and informed decisions.
In this article, we will discuss the approach to data processing practised at EvenBet Gaming, specifically focusing on data clustering and anomaly detection.
Seeking Anomalies
In poker statistics, there are hundreds of different indicators such as VPIP, PFR, 3bet, move time, bet size, and so on. In addition to what happens at the table, a large amount of data can be collected by observing the user’s behaviour in the room: the number of simultaneously launched tables, the length and profitability of gaming sessions, the average number of hands played per day, and so on.
It’s also possible to observe global trends based on indicators such as the number of registrations, deposit and withdrawal sizes and volumes, average online presence.
There are several approaches to data analysis. Let’s briefly review them.
Manual Data Analysis
This approach is suitable only for a small amount of data. There is also a chance of human error in the analysis.
Statistical Methods
For example, using a “box plot” or “box-and-whisker plot.” A box plot is a way to visually represent groups of numerical data through quartiles.
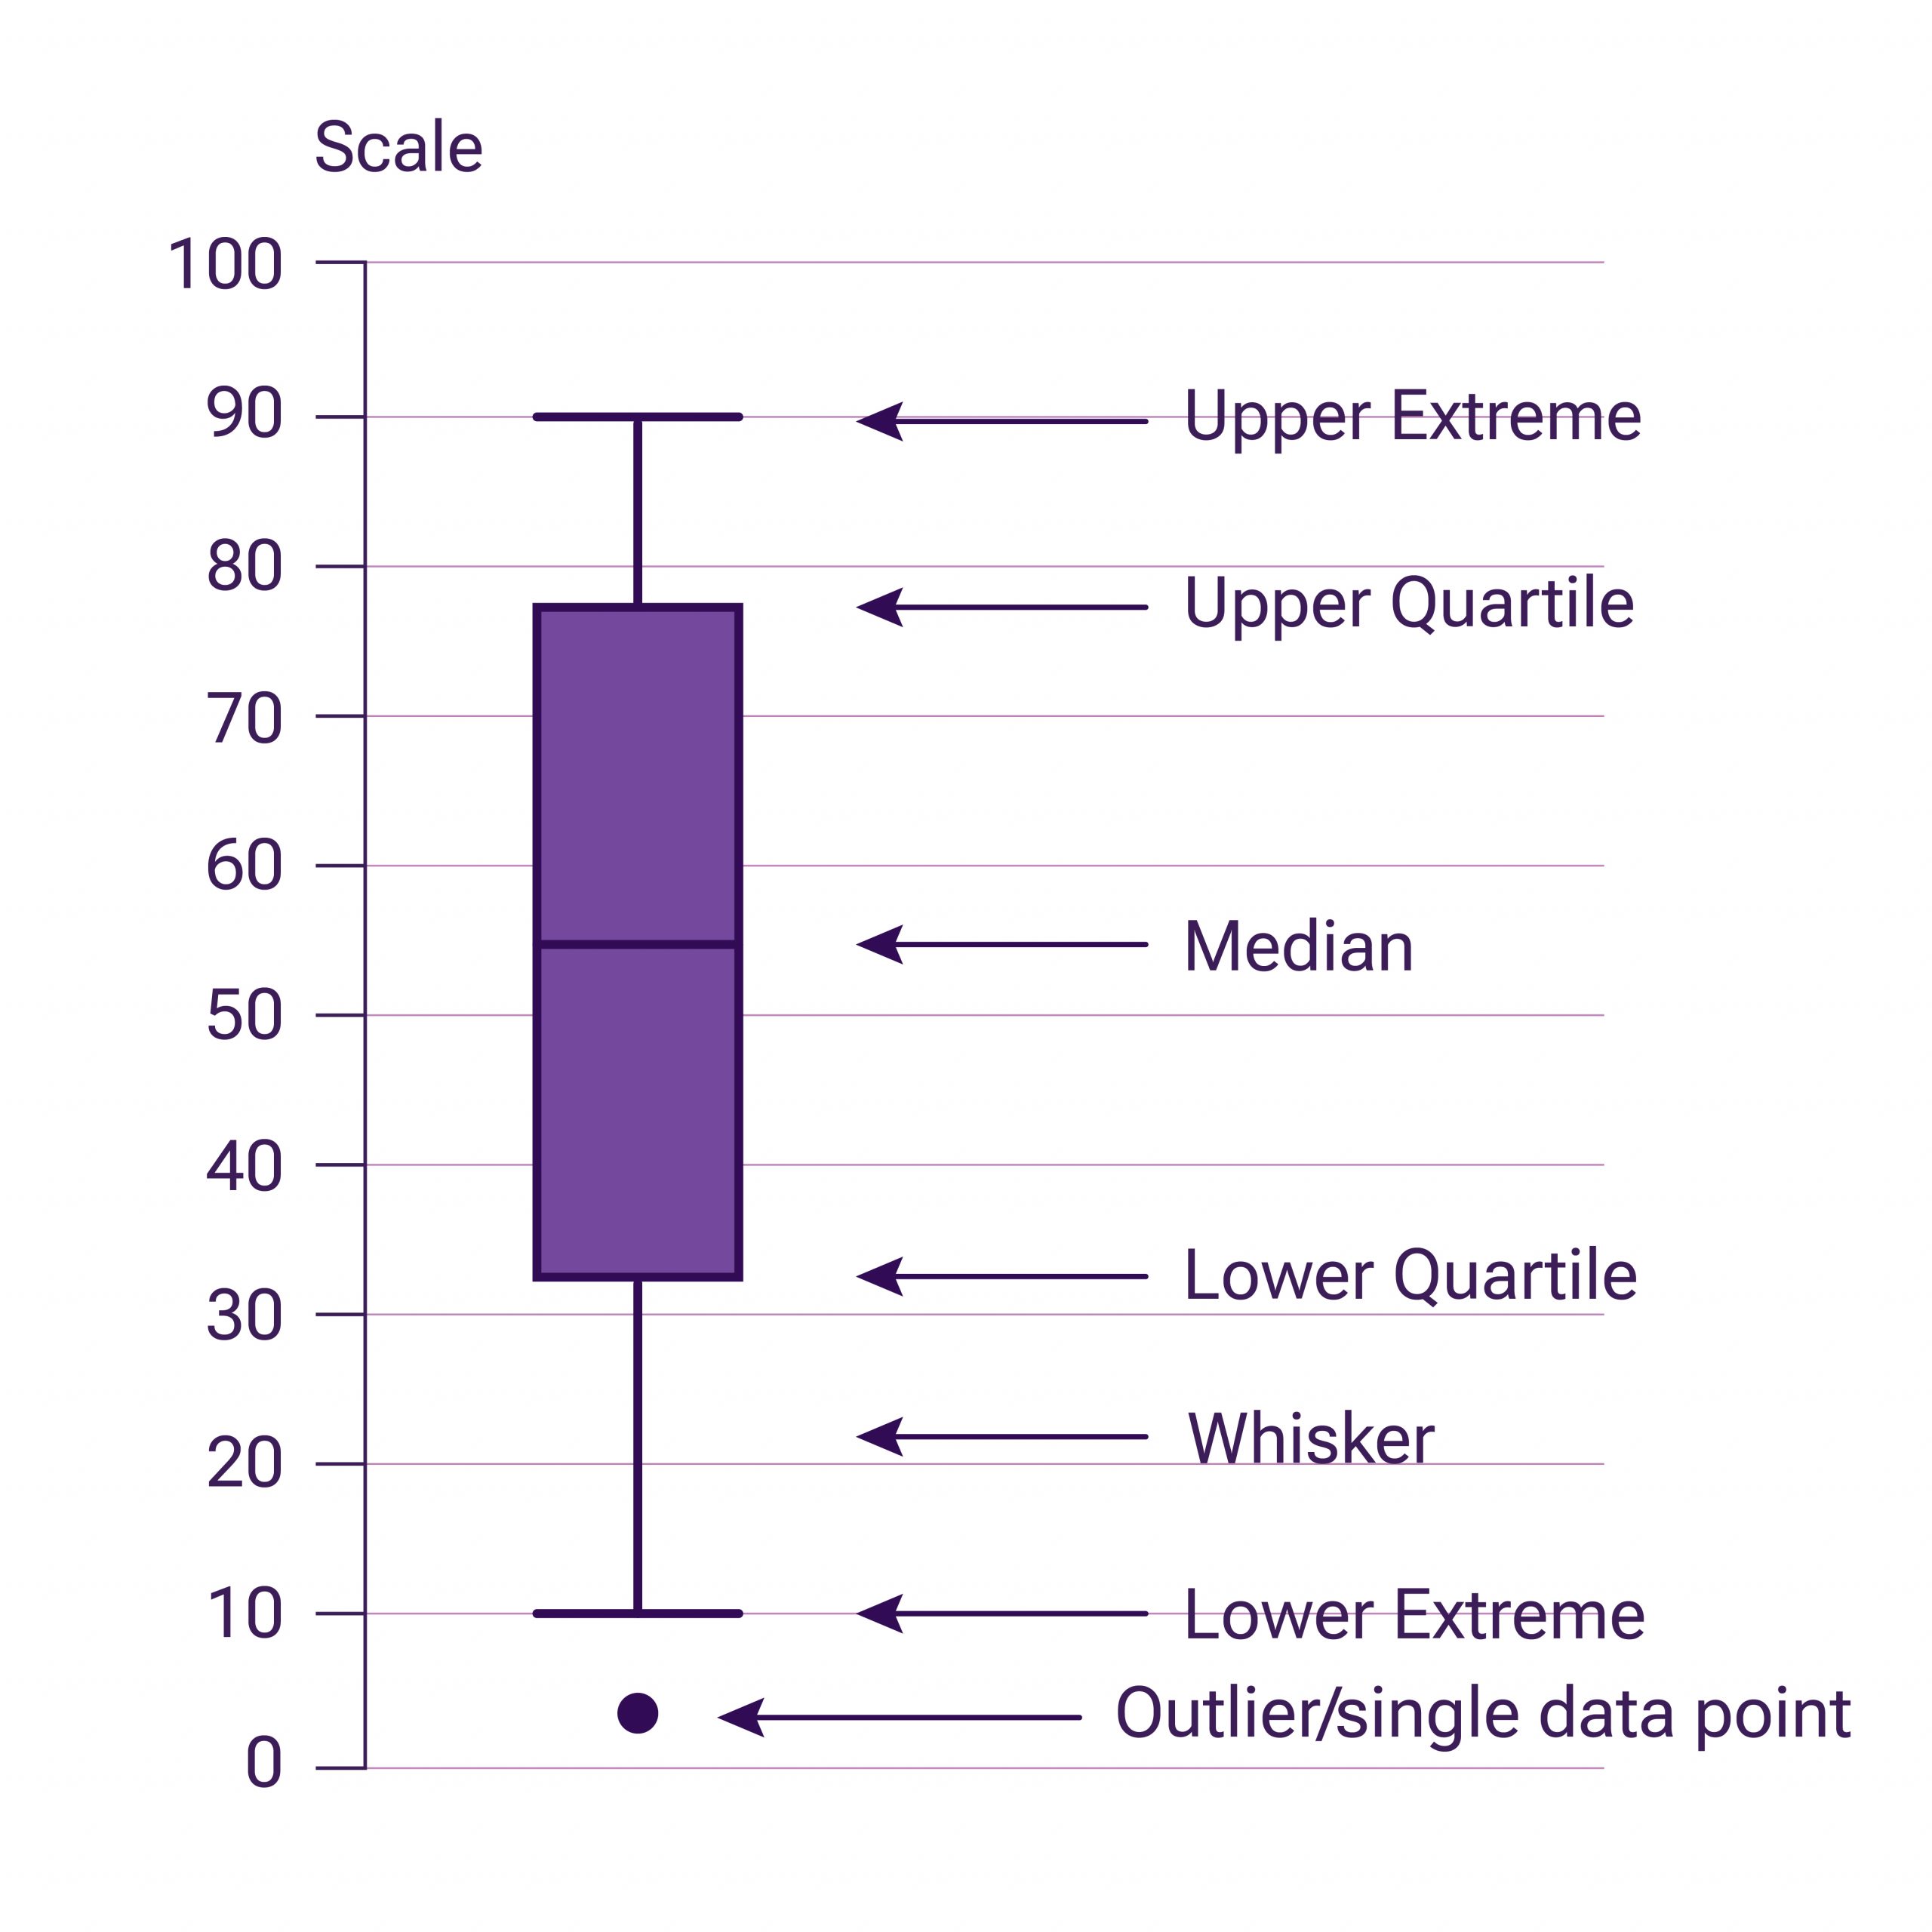
Outliers (anomalies) are sometimes displayed as individual points aligned with the whiskers. If a value falls outside with a big range from the nearest quartile, it is considered anomalous.
This approach can be done manually on paper or using various programs to construct such plots. Similar to manual anomaly detection, this method requires a considerable amount of time and attention from the person conducting the analysis.
Metric Methods
Metric methods are based on the assertion that an anomalous point will not have close neighbours — points that are in close proximity to it — unlike regular points. The majority of metrics are sensitive to changes in data, such as scaling. Even for robust metrics, there is a problem in selecting thresholds and metric parameters: for each dataset, there is a different distance from normal neighbours to anomalous points.
Machine Learning Methods
This category of methods is one of the most popular and modern. However, it is worth noting that the “black box” approach – loading data into a neural network in the hope of obtaining some result – will not work in anomaly detection.
To identify anomalies, it is necessary to analyse the results and, often, make changes to the internal parts of the algorithm. In the case of a “black box,” it will be quite challenging to understand how the algorithm works and explain how it arrives at a particular decision.
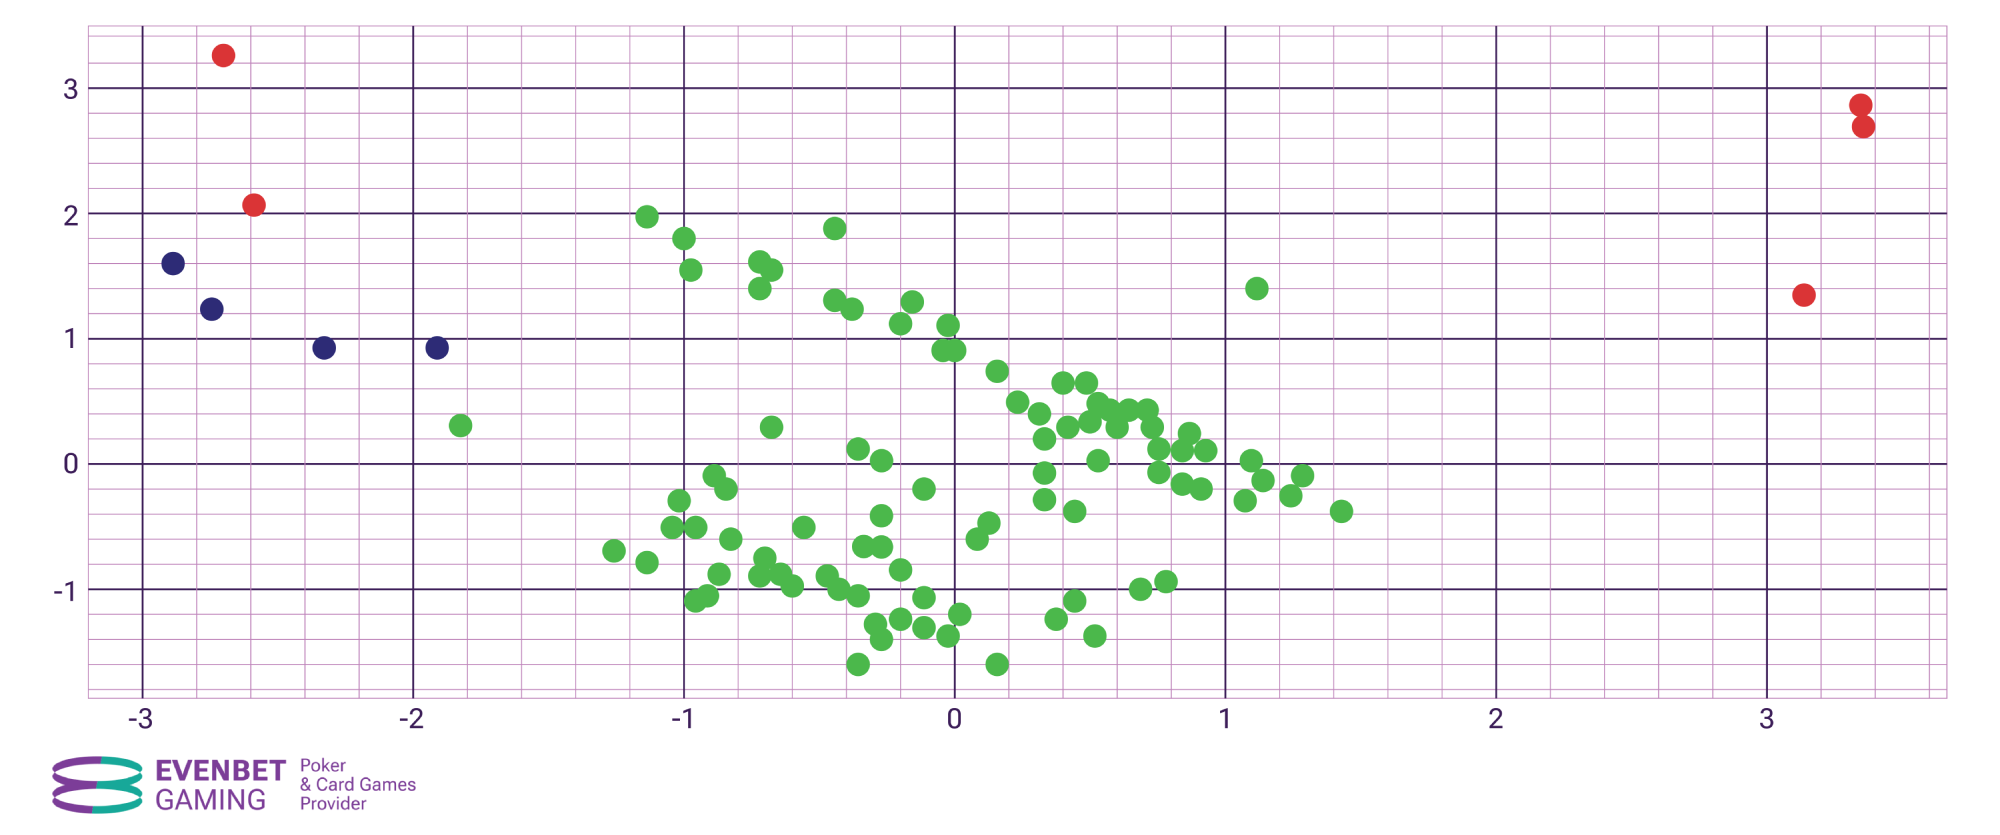
The task of anomaly detection can be considered a special case of the clustering problem: anomalies are nothing more than “noise” among clusters, i.e., data points that do not fall into any cluster. Let’s consider the results of clustering in the example illustrated below. In the figure, anomalies are marked with red dots.
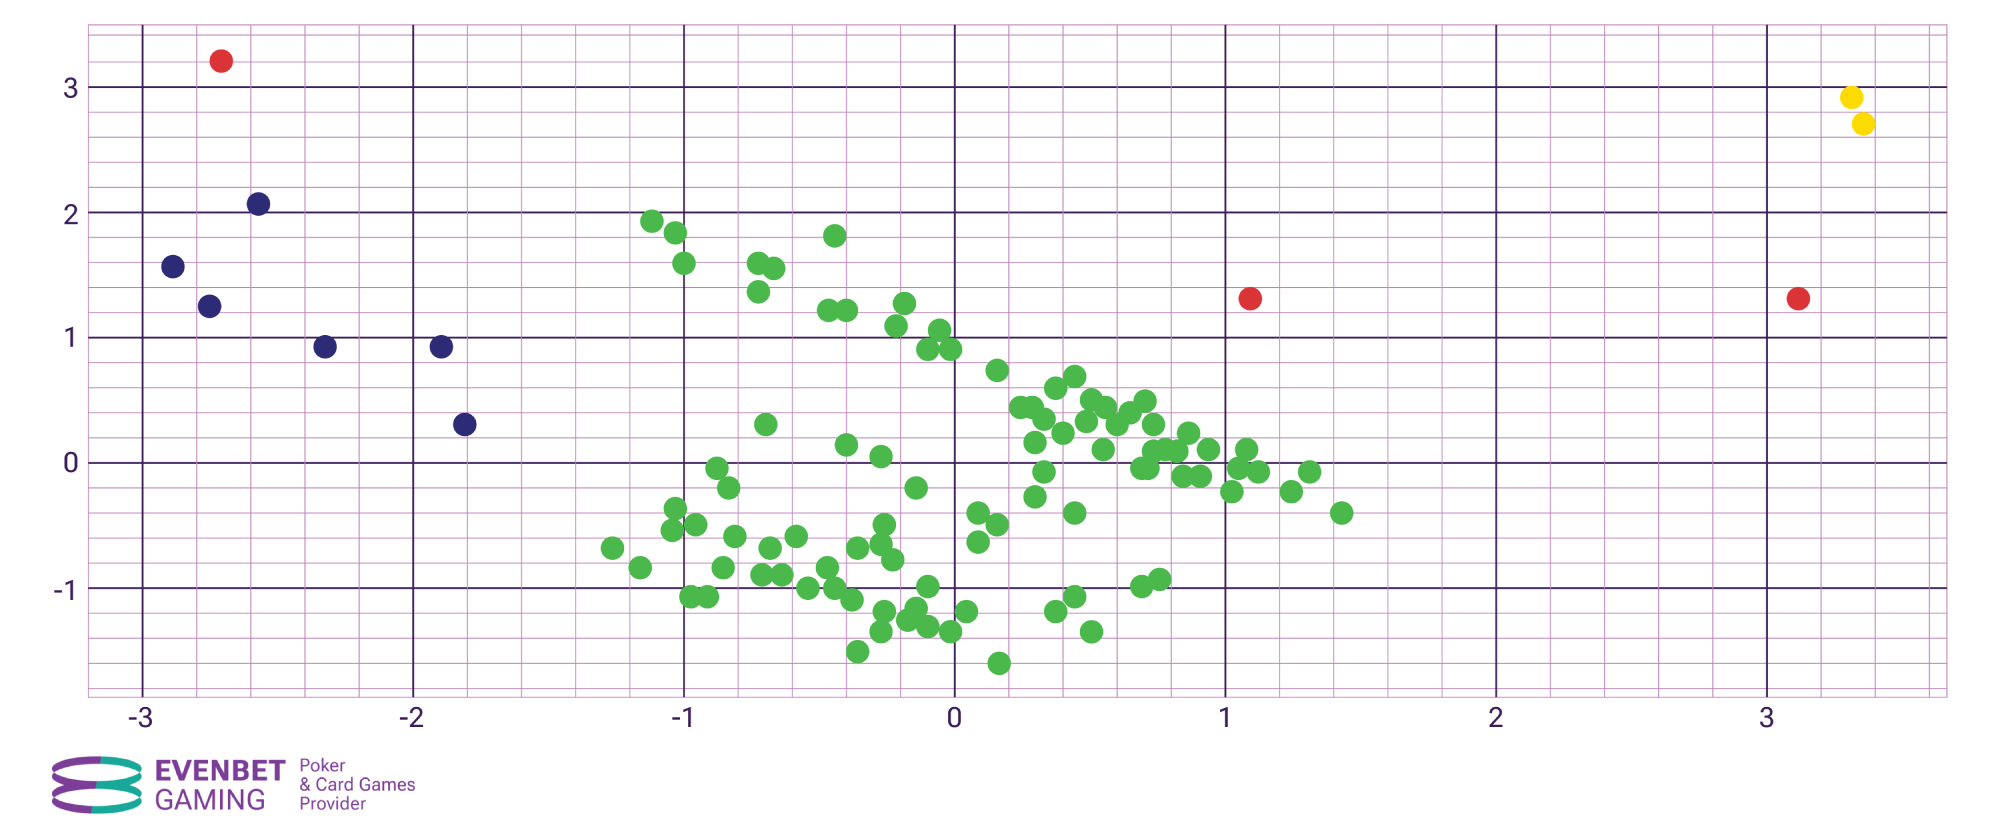
As a result of clustering, three clusters were formed – green, the largest one, blue, smaller, and yellow, consisting of only two points. The remaining points did not fall into any of the clusters and are therefore considered anomalies.
Machine Learning Algorithms of Data Analysis
Clustering
At EvenBet Gaming, we considered the option of applying the “k-means” method, but it was not suitable for analysing our data. One of the drawbacks of this method is that you need to know in advance how many clusters there should be.
Now we use Density-Based Spatial Clustering of Applications with Noise (DBSCAN). If a set of points is given, the algorithm groups together points that are closely located — points with a large number of close neighbours — marking as outliers points that are in areas of low density, whose nearest neighbours are far away.
The DBSCAN belongs to the category of “Unsupervised Learning” algorithms.This category assumes that the system does not receive correct answers from a human and finds them on its own. It’s worth noting that the task of clustering data, in general, is solved precisely by this category of algorithms.
Data Reduction
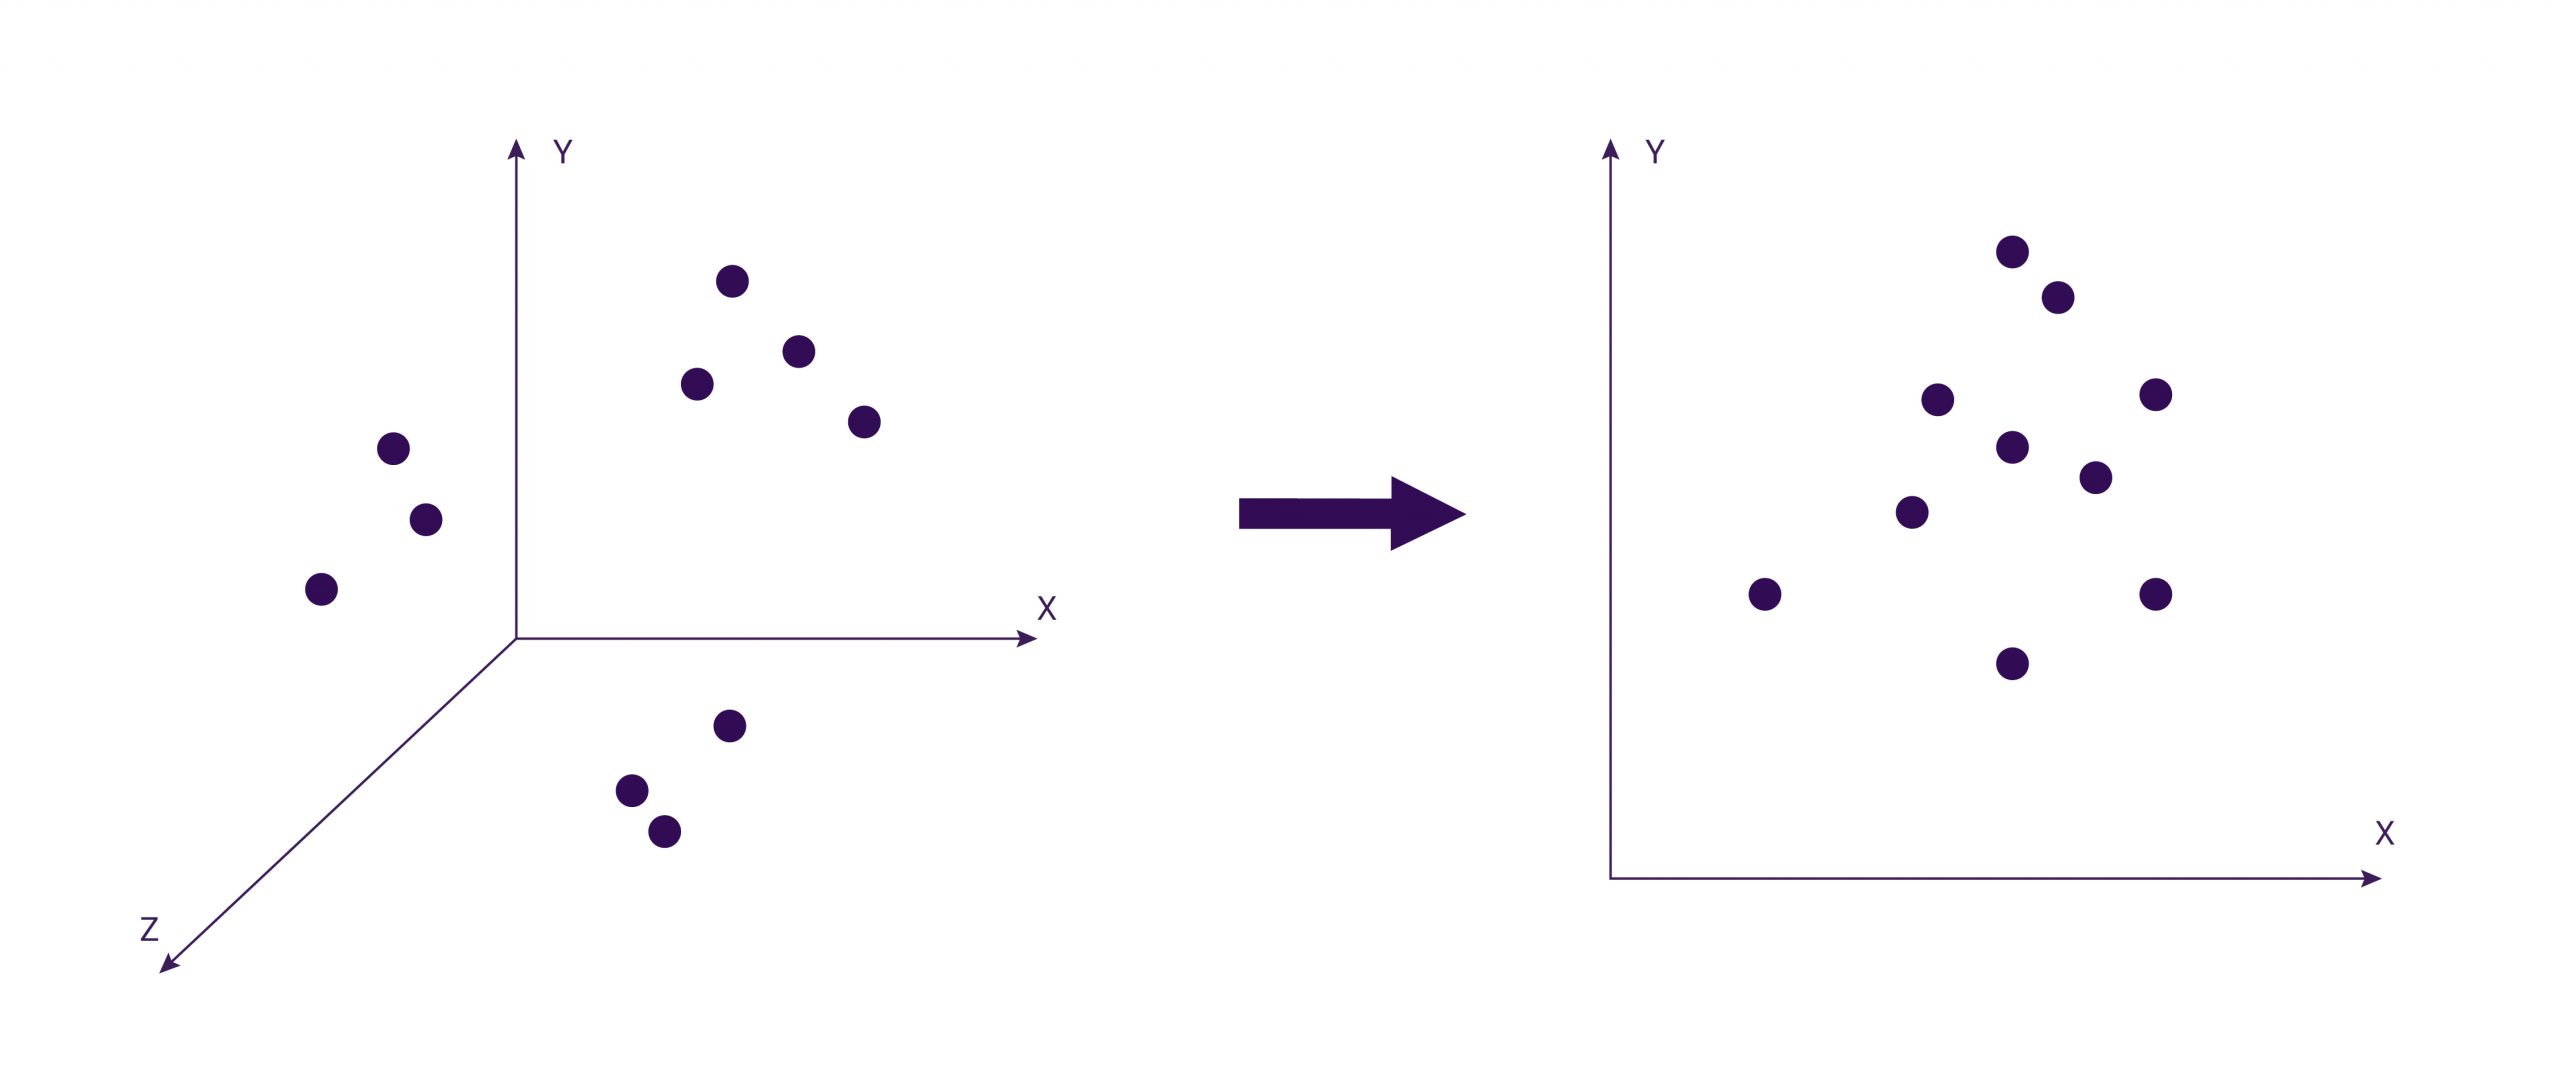
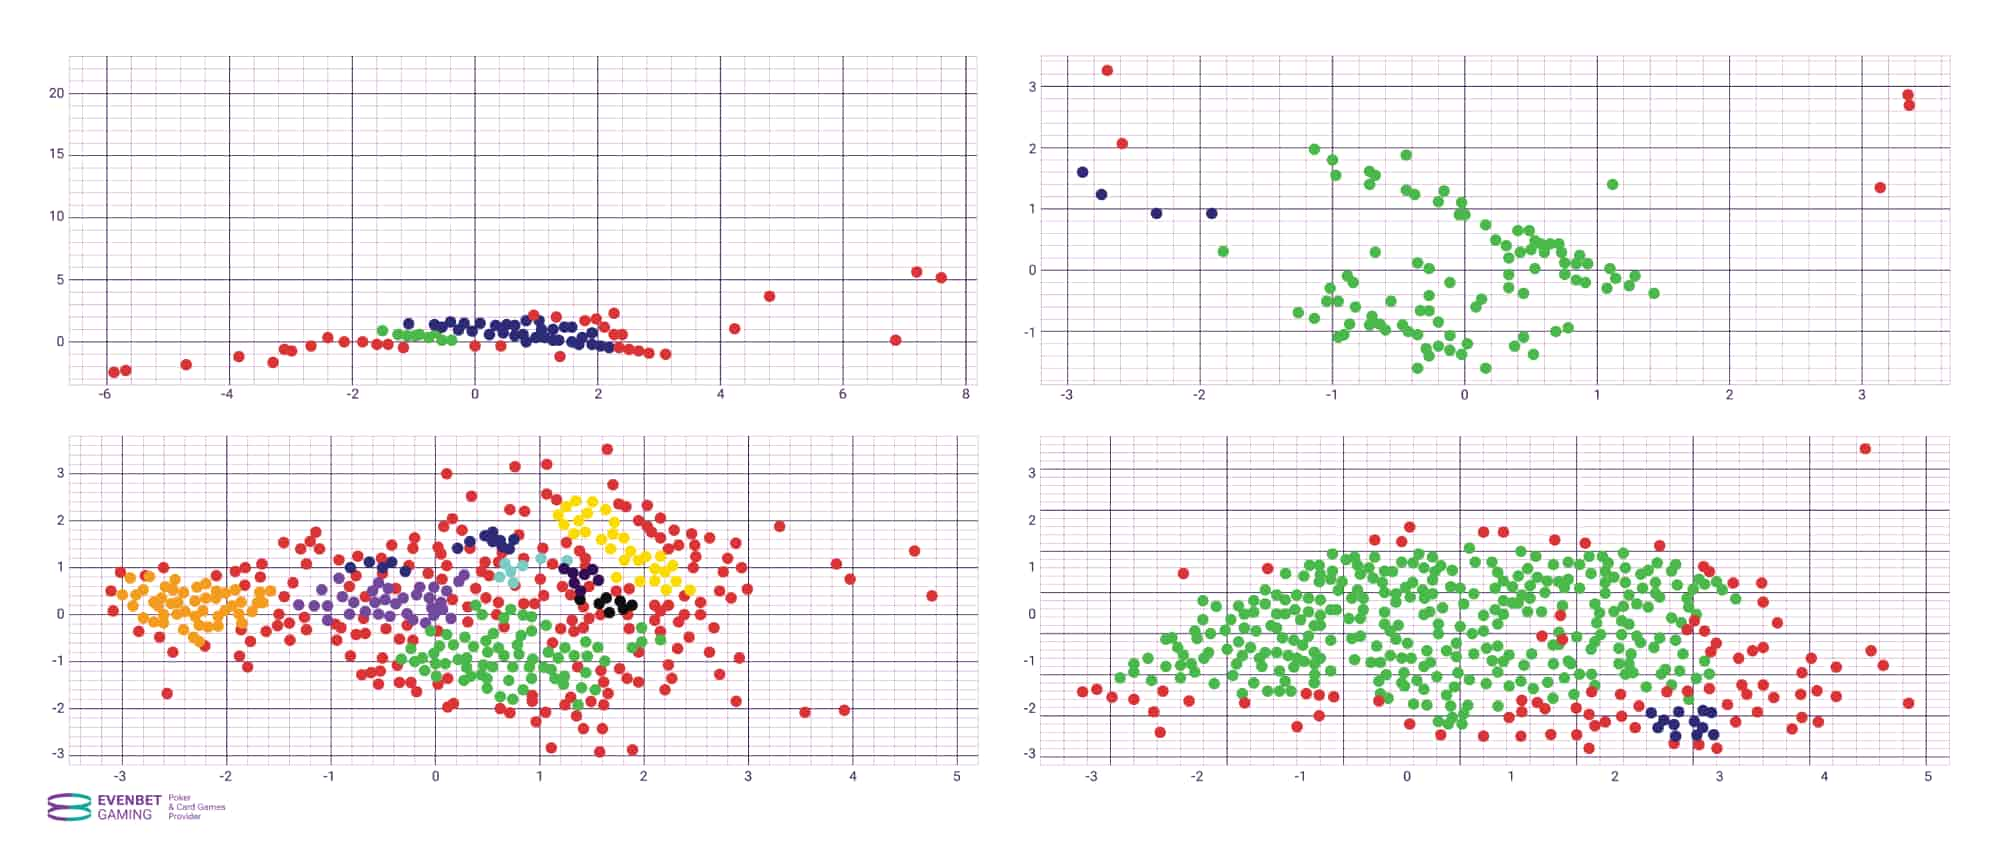
We can obtain data for various dimensions. Most algorithms are focused on clustering data in a two-dimensional space with coordinates x, y. Therefore, dimensionality reduction is used: reducing the number of features in this set. The figure below shows one of the options for reducing the dimensionality of data – transforming a three-dimensional data set into a two-dimensional one:
There are special algorithms for dimensionality reduction of data, such as PCA, t-SNE, and UMAP. Principal Component Analysis (PCA) approximates an n-dimensional cloud of observations to an n-dimensional ellipsoid. The figure below illustrates the principle of PCA. PC1 and PC2 are referred to as principal components.
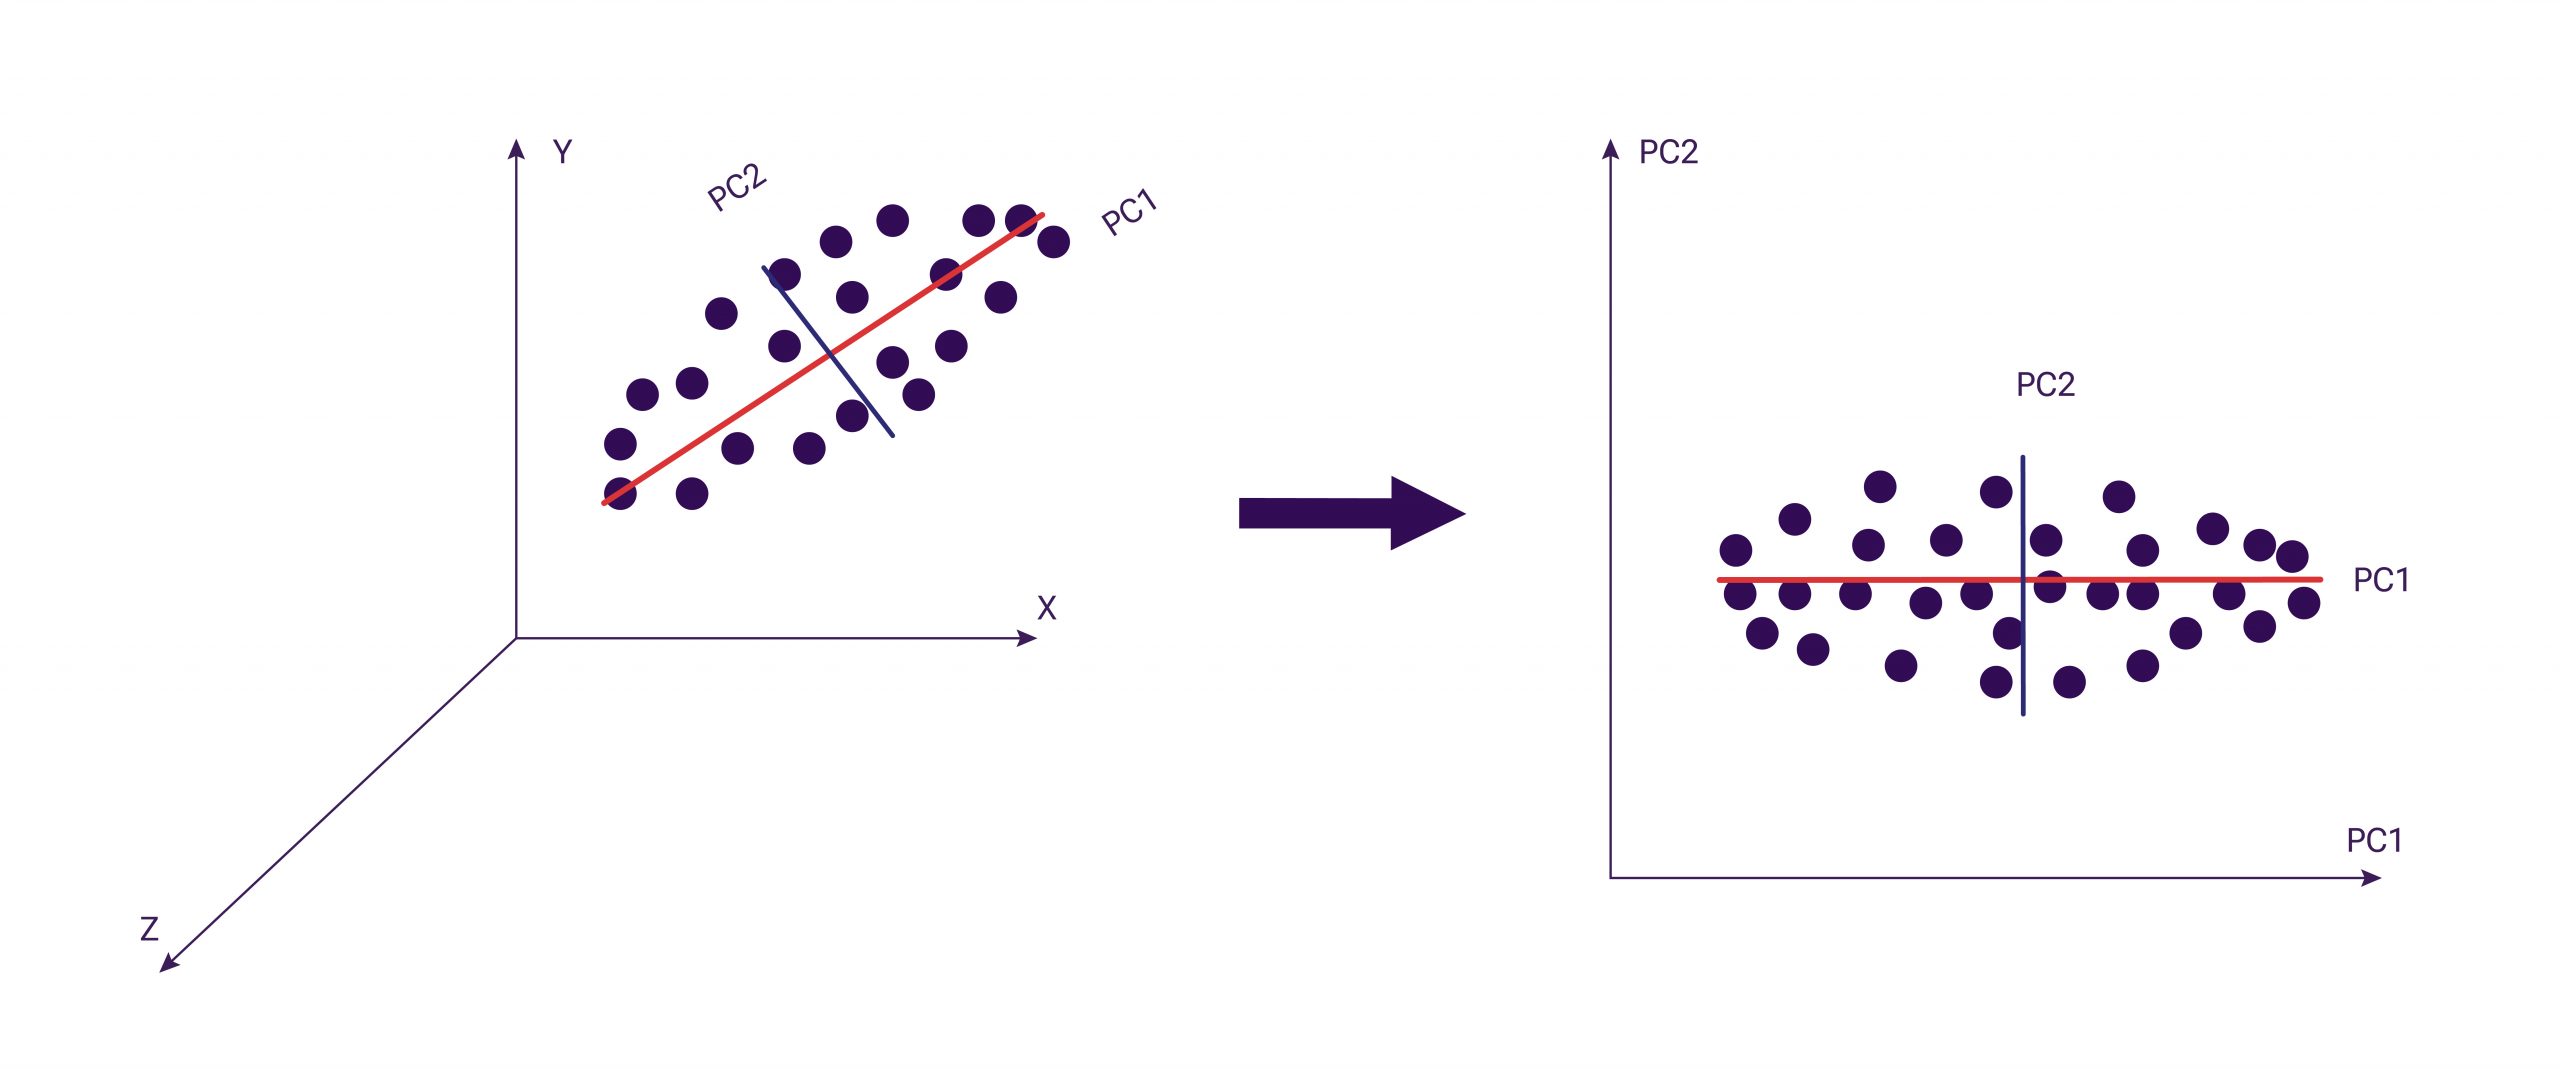
The figure shows the data before and after PCA processing. In this example, each column represented a separate dimension. As you can observe, before processing, there were 3 dimensions, and became 2 after processing.
Reducing the number of dimensions, even though some information is lost, leads to more understandable clusters and accelerates computations. Also, it is needed to visually represent and analyse data.
Searching Anomalies
To detect anomalies, a special type of clustering based on density is required. In such algorithms, areas of point concentration are identified, and then they are separated from empty and sparse areas. Remote points are marked as noise (anomalies).
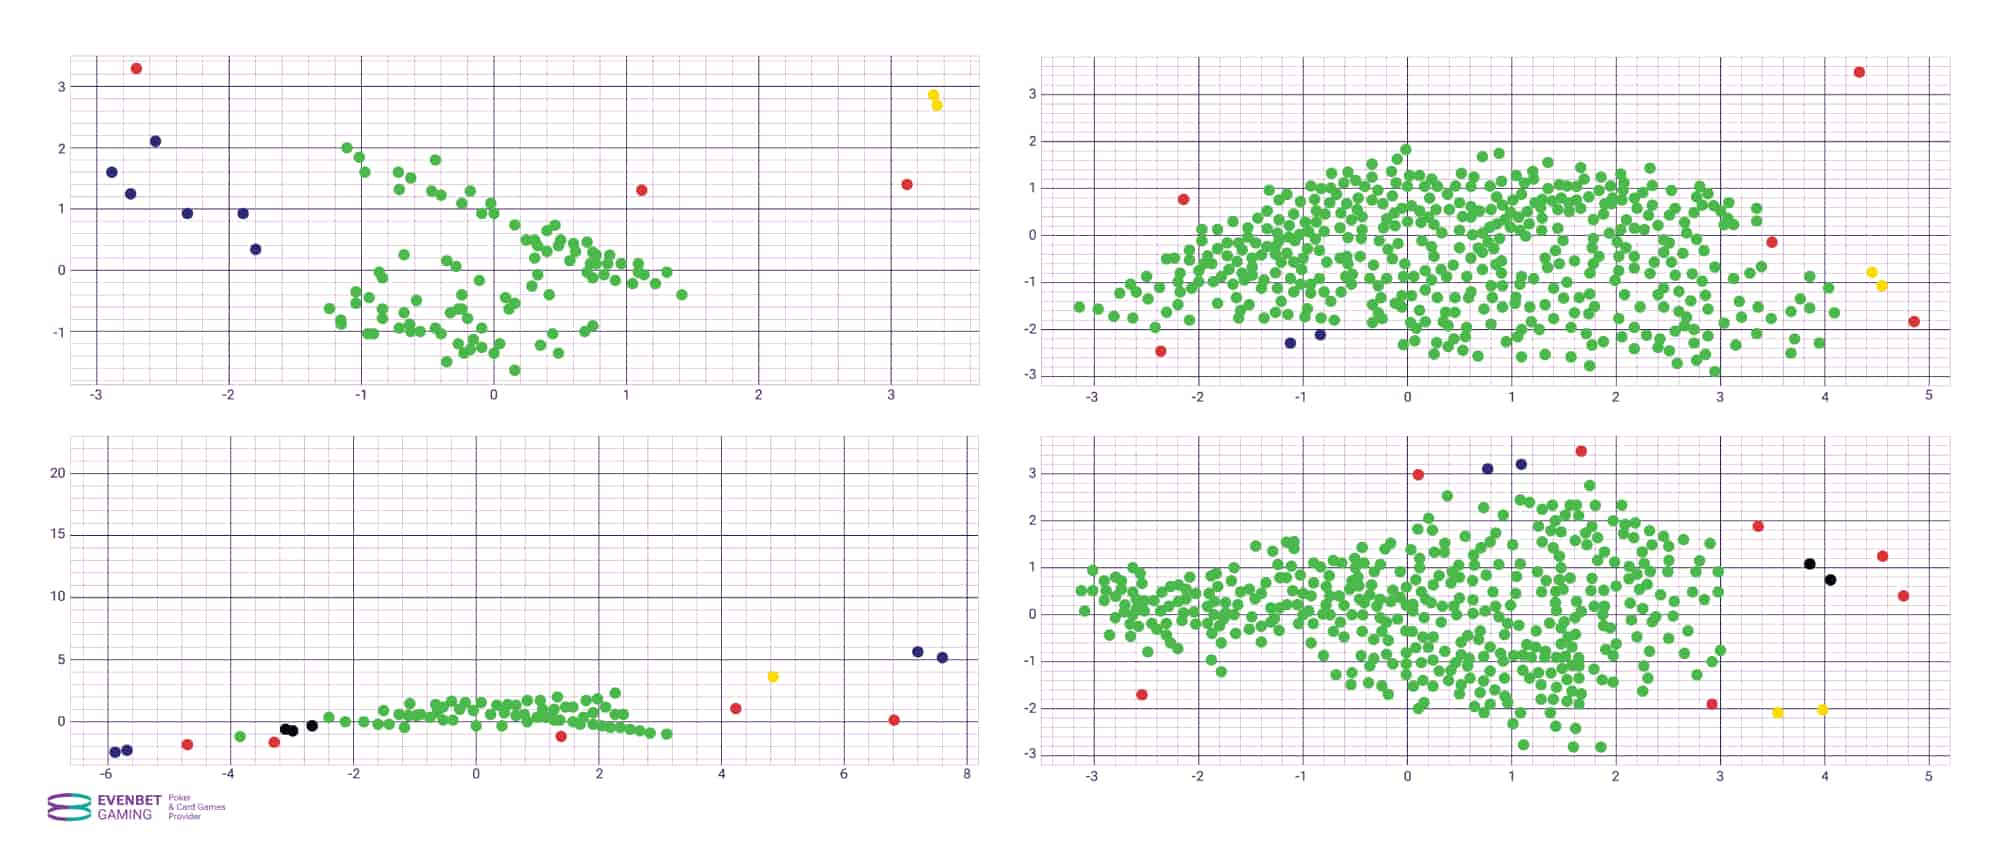
We considered using Hierarchical Density-Based Spatial Clustering of Applications with Noise (HDBSCAN) for this purpose. In short, HDBSCAN is an implementation of DBSCAN that automatically considers different distance values between points.
The algorithm requires only the minimum cluster size as the sole input parameter. This allows HDBSCAN to find clusters of varying density (unlike DBSCAN) and be more robust to parameter selection.
The results:
Many points that could belong to an existing cluster are marked as anomalies by HDBSCAN. This is because, during the automatic selection of the minimum distance between points, small clusters in sparse areas are lost, or they merge into other clusters separated by a relatively large distance. To overcome this drawback, a combination of HDBSCAN and DBSCAN is used.
Final results using DBSCAN – main clusters have been identified, and points significantly distant from them are marked in red as anomalies:
Prospects of Data Clustering
Clustering can be conducted to search for anomalies among games and users – it’s necessary to select a suitable set of input features that best represent them and the method of processing and accounting for this data when predicting anomalies.
After the anomaly calculation stage, security specialists usually conduct an investigation – anomalies can signal both dishonest users and games, as well as system errors.
Having information about emerging anomalies, room owners can make timely decisions to eliminate them, thereby preventing money and user churn, and counteracting global fraudulent operations.
At EvenBet Gaming, we continue to conduct research in the field of data analysis, applying the latest scientific achievements and technologies to provide the most secure software, giving our clients an advantage in the highly competitive online gambling market. If you want to discuss your project, including its technical aspects, with our specialists, please contact us.